You can also view this newsletter as a PDF.

Climate Action 100+ Progresses
Toward Paris Climate Goals in 2019
 Companies are listening to a coalition of more than 370 investors advocating for immediate action to ensure sustainability and protect investment returns by reducing greenhouse gas emissions and meeting the climate goals of the Paris Agreement. However, the pace of change still is frustratingly slow, according to the first annual report of the five-year Climate Action 100+ initiative.
The work of Climate Action 100+ is supported by five partner networks: the Investor Group on Climate Change; Institutional Investors Group on Climate Change; Asia Investor Group on Climate Change; Principles for Responsible Investment; and the global nonprofit Ceres, of which Controller Yee is a board member.
Launched in December 2017, Climate Action 100+ was based on a California Public Employees’ Retirement System (CalPERS) carbon footprint analysis of its global equity portfolio. After finding 80 companies were responsible for half of the portfolio’s emissions, Ceres recognized there was power in numbers and recruited other investors, including the California State Teachers’ Retirement System (CalSTRS), to develop a list of 161 public companies responsible for 80 percent of the world’s industrial emissions.
This coalition helps CalPERS and CalSTRS protect long-term investments in companies, since their returns are crucial to ensuring retiree benefit payments. Banding together, Climate Action 100+ investors and asset managers with a combined $35 trillion in assets developed the following engagement strategy to address climate change impacts on the long-term profitability of the companies they invest in:
- Implement a strong corporate governance framework to articulate board accountability for, and oversight of, climate change risks and opportunities;
- Take action to reduce greenhouse gas emissions across company operations, consistent with the Paris Agreement to limit global temperature increase well below two degrees Celsius; and
- Disclose climate risks in line with recommendations from the Task Force on Climate-related Financial Disclosures (TCFD) to help investors assess company business plans against a range of climate scenarios.
In the first year of Climate Action 100+, the initiative recorded several successes. Companies such as Xcel Energy, Maersk, Nestle, Volkswagen, Duke Energy, and Heidelberg Cement pledged to reach net-zero emissions or become climate-neutral by 2050. Large mining companies like Rio Tinto and Glencore announced they would cap coal production at current levels and review their assets to set emission-reduction targets. PetroChina developed a climate change strategy and is considering aligning its climate policy to the Paris Agreement goals.
 Climate Action 100+ also successfully secured four agreements with energy companies Shell, British Petroleum, and Equinor, along with mining company Glencore, to enhance disclosure, reduce emissions, set targets, and tie targets to executive compensation.
In addition to specific company pledges, Climate Action 100+ defined investor expectations on corporate lobbying activity including reviewing trade association membership and ensuring advocacy work does not violate Paris Agreement goals. Companies also are beginning to define new approaches to alignment of emissions through target setting and future capital expenditures.
Climate Action 100+ is off to a strong start:
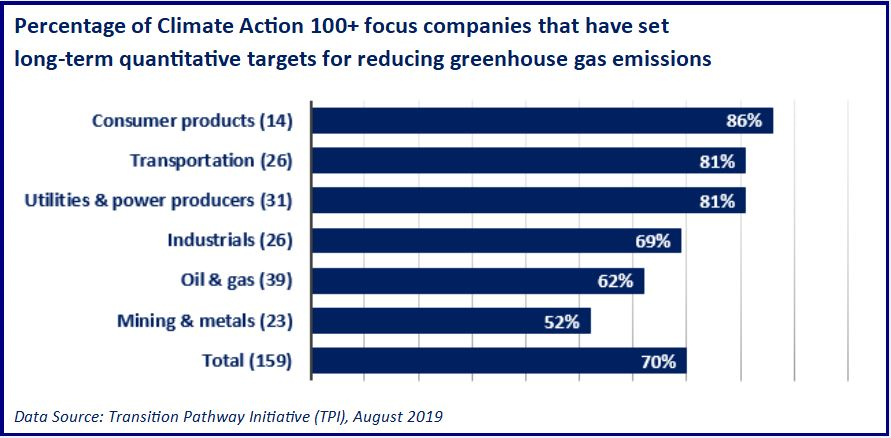
- Seventy percent of companies engaged have set long-term emissions reduction targets.
- Nine percent have emissions targets in line with (or lower than) the minimum goal of two degrees Celsius.
- Eight percent of companies have policies to ensure their lobbying activity is aligned with necessary action on climate change.
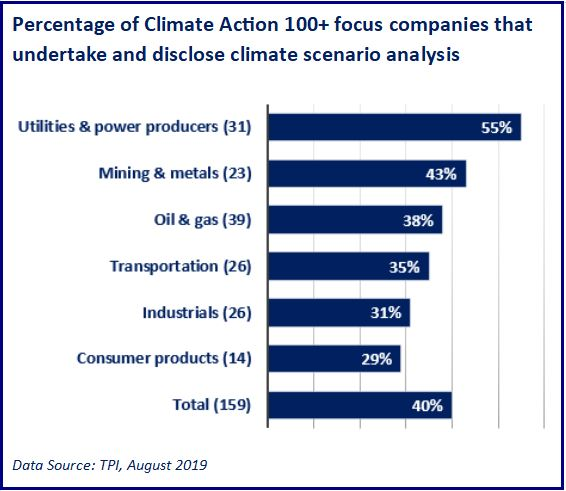
- Forty percent undertake and disclose climate scenario analysis, and 30 percent of companies have formally supported TCFD recommendations.
- Seventy-seven percent have defined board accountability for climate change.
Understanding City Tax Revenue in California
For the 2017-18 fiscal year, California’s 482 cities reported $83.42 billion in revenues and $81.08 billion in expenditures. Los Angeles, San Francisco, San Diego, and San Jose generated the majority of their general fund revenue from taxes, with property taxes being the main source for most. Other taxes include the utility user tax, business license tax, transient occupancy tax, and sales and use tax.
Utility User
 The utility user tax is imposed on the consumption of utility services such as electricity, gas, water, sewer, telephone, sanitation, and cable television. Either the city or the county may levy this tax, which generally is collected by a utility company as part of the normal billing process and then remitted to the city or county. The rate varies by location; the highest rate is
12.5 percent and the lowest is 1 percent. San Diego does not have a utility user tax. For FY 2017-18:
- Los Angeles, with a utility user tax rate of 10 percent, collected $640.7 million, which was 15.2 percent of total general revenue;
- San Francisco, with a rate of 7.5 percent, collected $94.5 million, which was 2.8 percent of total general revenue; and
- San Jose, with a rate of five percent, collected $120.2 million, which was 14.3 percent of total general revenue.
Business License
A business license is required to conduct business in any California city. Most cities impose a business license tax; the tax computation and rate varies. For Los Angeles, the tax generally is based on gross receipts, and the rate is a specified amount per $1,000 of taxable gross receipts for each tax classification. For example, the tax rate for a Los Angeles retail sales business is $1.27 per $1,000 of gross receipts and $1.01 per gross receipts for a multi-media business. San Francisco’s business license tax also is a gross receipts tax with varying tax rates depending on the type of business. For FY 2017-18:
- Los Angeles collected $535 million, which was 12.7 percent of total general revenue;
- San Francisco collected $454.9 million, which was 13.3 percent of total general revenue;
- San Diego collected $20.7 million, which was 1.6 percent of total general revenue; and
- San Jose collected $70.7 million, which was 8.4 percent of total general revenue.
Transient Occupancy
The transient occupancy tax is imposed in most cities in the United States, including 419 California cities. Counties may impose the transient occupancy tax, but only in unincorporated areas. The tax is imposed on travelers when they rent accommodations in a hotel, motel, or other lodging for a period of 30 days or less. The tax rate varies by location. It is collected by the property operator and remitted to the city or county. The highest rate is 15 percent and the lowest is 4 percent.
For FY 2017-18:
- Los Angeles, with a transient occupancy tax rate of 14 percent, collected $303.1 million, which was 7.2 percent of total general revenue;
- San Francisco, with a rate of 14 percent, collected $382.2 million, which was 11.2 percent of total general revenue;
- San Diego, with a rate of 10.5 percent, collected $231.9 million, which was 17.4 percent to total general revenue; and
- San Jose, with a rate of 10 percent, collected $48.9 million, which was 5.8 percent of total general revenue.
Sales and Use
Retailers engaged in business in California pay the sales tax, which applies to all retail sales of goods and merchandise, except those sales specifically exempted by law. The use tax generally applies to the storage, use, or other consumption in California of goods purchased from retailers in transactions not subject to the sales tax. The sales and use tax rate in a California locale has three parts: the state tax rate, the local tax rate, and any district tax rate that may be in effect. As of July 1, the sales and use tax rate is 9.5 percent in Los Angeles, 9.25 percent in San Jose, 8.5 percent in San Francisco, and 7.75 percent in San Diego.
Sales and use taxes provide revenue to the state’s general fund, to cities and counties through specific state fund allocations, and to other local jurisdictions.
For FY 2017-18:
- Los Angeles collected $534.2 million, which was 12.7 percent of total general revenue;
- San Diego collected $314 million, which was 23.5 percent of total general revenue;
- San Francisco collected $298.2 million, which was 8.7 percent of total general revenue; and
- San Jose collected $177.4 million, which was 21.0 percent of total general revenue
Property
Unless the California Constitution or federal law specifies otherwise, all property is subject to tax. Except for state-assessed property, the county assessor is responsible for determining the value of all taxable property in the county. The collection of property taxes and their allocation to the appropriate taxing jurisdictions are functions of the county tax collector and the county auditor, respectively. For FY 2017-18, the total tax for secured and unsecured California property was more than $74 billion. For this same time period:
- Los Angeles collected $1.28 billion, which was 30.5 percent of total general revenue;
- San Francisco collected $1.43 billion, which was 41.9 percent of total general revenue;
- San Diego collected $360.06 million, which was 27 percent of total general revenue; and
- San Jose collected $198.9 million, which was 23.6 percent of total general revenue.
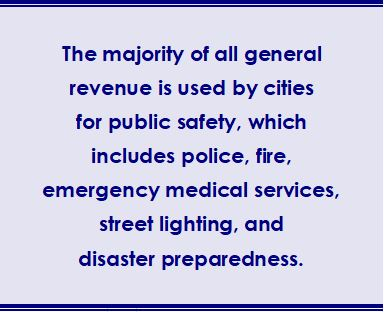
The majority of all general revenue is used by cities for public safety, which includes police, fire, emergency medical services, street lighting, and disaster preparedness.