
More on California Fiscal Policy: Changes in the Composition of the General Fund
Forty-nine years ago last month, the No. 1 song in London was the Rolling Stones’ (I Can’t Get No) Satisfaction. It had been released earlier in the U.S., and peaked on the charts across the pond in August 1965. In the song, written on the road during the Stones’ second U.S. tour, Mick Jagger laments the American appetite for marketing and incessant retailing.
Unlike Jagger, California’s finances got plenty of satisfaction from retail therapy in the 1960s. In fact, for most of the post-war period, the sales tax was the State’s biggest revenue source. In 1970-71, it accounted for 50 percent more revenue than did the second-highest source of revenue, the personal income tax. But things have changed.
In 1983-84, the income tax superseded the sales tax as the State’s largest revenue source. Since then it has become the dominant General Fund revenue source. By 2012-13, the income tax generated $3 for every dollar generated by the sales tax.
In the 15 years since 1998-99, overall revenue grew from $58.0 billion to $96.0 billion, implying an average annual growth rate of 3.6 percent. The personal income tax made the greatest contribution to the General Fund. It generated $30.9 billion in 1998-99 and nearly $65.3 billion in 2012-13, growing at an average annual rate of about 5.5 percent. Though it had the greatest point-to-point average growth rate, it also demonstrated large year-over-year declines in 2001-02 and 2008-09. During the same period, other tax streams grew at much slower rates, specifically:
- The corporate tax grew from $5.7 billion to $7.5 billion (an average annual growth rate of 1.9 percent), with year-over-year declines in 2001-02, 2008-09, 2011-12 and 2012-13.
- The sales tax started at $18.9 billion in the first year and ended at $20.5 billion, increasing at a 0.6 percent annual rate. Other General Fund revenues -- combined proceeds from minor taxes including the insurance and cigarette tax -- had virtually no growth over the period.
The disparate growth rates reflect many factors. When the federal government phased out the estate tax, for example, the State lost $1 billion in annual inheritance tax revenue included in the “other taxes” category. Because the Legislature earmarked portions of the sales tax for paying off the deficit bond and funding realignment, some sales tax revenue was excluded from the later years. Congress and the Legislature contracted (in the case of indexing) and expanded (in the case of closely-held corporations, known as “Sub-S corps”) the income and corporate tax bases over the years. Proposition 30, approved by voters in 2012, increased the sales and personal income tax rates, so that the blue and red lines are higher for the last two years.
Figure 2: General Fund Taxes 1998-99 Through 2012-13
(Dollars in Millions)
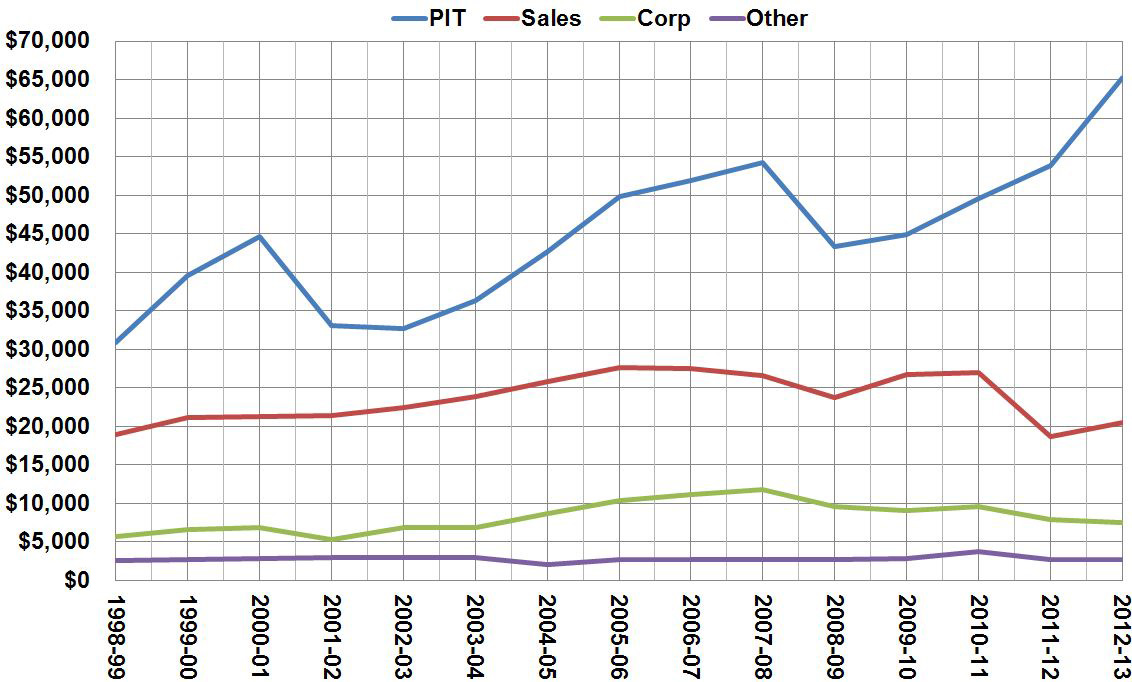
Source: Department of Finance (Aug. 21, 2014)