
Bottom Line: What the Numbers Mean | Receipts | Disbursements
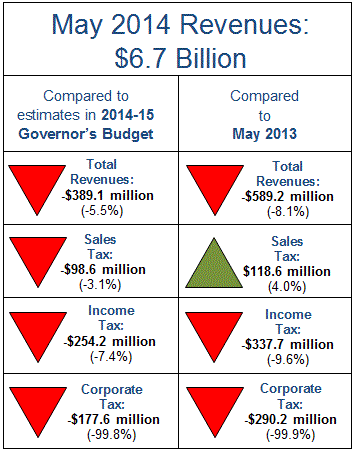 May was disappointing for California's revenues, with all three major sources of tax receipts falling short of expectations for the month. Relative to projections made by the Department of Finance as part of the Governor’s Budget submitted in January, the State’s top revenue generators were a combined $530 million, or 7.8 percent, below estimates.
Personal income taxes accounted for the largest part of the discrepancy, with a shortfall of $254 million. A surge in refunds reduced the net take of corporate taxes to almost zero in contrast to the $178 million that had originally been forecast. Both corporate and personal income taxes had been meeting or beating projections in recent months. Sales taxes had been somewhat underperforming compared to estimates and that trend continued in May, with a miss of $99 million, or 3.1 percent. (See Figure 1.)
For the entire fiscal year to date, spanning July 1, 2014 through May 31, 2014, the State’s financial picture is still bright. The sum of the State’s leading three revenue engines is $1.3 billion over projections. (See Table 1.) Higher-than-expected tax receipts from insurance companies and other sources, along with transfers from other funds, mean that, as of the end of May, total General Fund revenues were $1.8 billion above projections.1
On the spending side, disbursements for the 11 months of Fiscal Year 2013-14 were running about $0.7 billion ahead of projections contained in the Governor’s Budget. Most of the overage represented funds needed to support the increase in Medi-Cal recipients linked to the increase in eligibility under the Affordable Care Act.
Through May, California faced a difference between disbursements and total receipts of $6.1 billion, which was about $1.4 billion less than had been projected for this time as of January when the Governor submitted his original budget. The total outstanding loan balance of $8.5 billion, comprising the $6.1 billion from this year and the $2.4 billion deficit carried over from last year, was financed both from external sources and internal borrowing. Approximately $1.5 billion of Revenue Anticipation Notes (RANs) were repaid in May as scheduled.
May's revenue numbers should not be viewed with undue alarm. The leading three revenue sources in May usually account for about 7 percent of the year's total based on the performance of the past five years. June is a much more important period as it typically represents about 13 percent of the total.
Last month's somewhat soggy numbers do highlight the fact that the economy and revenue flows generally do not move in a straight line. California’s economy remains on an upward path, according to most indicators, and revenues should continue to advance. Yet, California remains vulnerable to various shocks, ranging from weather to foreign political or military conflicts. This potential volatility underscores the continuing importance of paring down the State’s indebtedness and building up its reserves.
1 May revenues in this report are usually compared against cash-flow projections contained in the "May Revise" budget proposal. This year, however, the Department of Finance, Controller's Office and Treasurer’s Office agreed that projections from the Governor's January budget proposal will suffice, in large part because the projection development process takes several weeks to complete, the State’s cash position remains positive (therefore no immediate cash management actions are necessary), and a timely budget is anticipated. The Department of Finance will complete full cash-flow projections once the new 2014-15 budget is adopted.
Figure 1: Tax Receipts Fall Short in May
Difference from Governor's Budget, millions of dollars
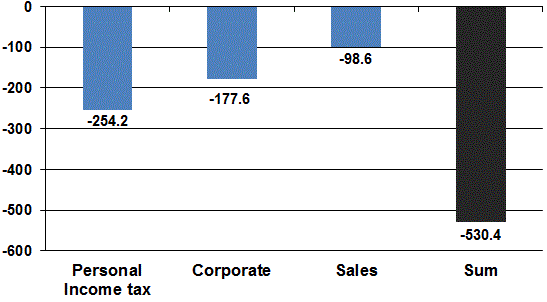
Table 1: General Fund Receipts
July 1, 2013 – May 31, 2014 (in Millions)
|
Revenue Source |
Actual Revenues | 2014-15 Governor's Budget Estimate | 2014-15 Governor's Budget Actual Over (Under) | 2012-13 Year-To-Date Actual | 2012-13 Year-To-Date Actual Over (Under) |
|---|---|---|---|---|---|
| Corporation Tax | $6,031.4 | $5,595.2 | $436.2 | $5,507.9 | $523.5 |
| Personal Income Tax | $56,936.3 | $55,882.3 | $1,054.0 | $59,285.0 | ($2,348.7) |
| Retail Sales and Use Tax | $20,132.5 | $20,281.6 | ($149.1) | $18,023.2 | $2,109.3 |
| Other Revenues | $3,687.0 | $3,246.9 | $440.2 | $4,137.9 | ($450.8) |
| Total General Fund Revenue | $86,787.3 | $85,006.1 | $1,781.2 | $86,954.0 | ($166.7) |
| Non-Revenue | $2,122.5 | $1,880.7 | $241.7 | $2,966.8 | ($844.3) |
| Total General Fund Receipts | $88,909.8 | $86,886.8 | $2,022.9 | $89,920.7 | ($1,011.0) |
Table 2: General Fund Disbursements
July 1, 2013 – May 31, 2014 (in Millions)
| Recipient | Actual Disbursements | 2014-15 Governor's Budget Estimate | 2014-15 Governor's Budget Actual Over (Under) | 2012-13 Year-To-Date Actual | 2012-13 Year-To-Date Actual Over (Under) |
|---|---|---|---|---|---|
| Local Assistance | $69,069.3 | $69,342.8 | ($273.5) | $59,860.0 | $9,209.3 |
| State Operations | $25,285.8 | $25,516.1 | ($230.3) | $22,062.7 | $3,223.0 |
| Other | $623.6 | ($537.2) | $1,160.8 | $1,659.5 | ($1,036.0) |
| Total Disbursements |
$94,978.6 | $94,321.7 | $656.9 | $83,582.2 | $11,396.4 |