
 News
California Fiscal Issues and Information page
California Fiscal Focus
Summary Analysis of General Fund Cash Receipts (2007 - 2014)
October 2014 Cash Report Summary Analysis
Guest Column: Dive Into City, County Financial Data With New Website
News
California Fiscal Issues and Information page
California Fiscal Focus
Summary Analysis of General Fund Cash Receipts (2007 - 2014)
October 2014 Cash Report Summary Analysis
Guest Column: Dive Into City, County Financial Data With New Website
Guest Column: Dive Into City, County Financial Data With New Website
Published October 10, 2014
 By Controller John Chiang
As California State Controller, my job hinges on having access to the State’s cash and budget numbers. Those are the numbers that also help me to tell the stories about the direction our State, communities, schools and businesses are heading.
We also share the belief that in order to enhance civic participation, we should be harnessing technology to allow the public to slice-and-dice financial information and create visuals that foster informed communication.
With this in mind, I took a hard look at some of the local government annual financial transaction reports my office collects and publishes. These 700-page publications are requested by engaged citizens and reporters, mailed out in hard copies or disc format. My office has published these reports for more than 100 years in seldom-used paper form. After a century, it was time to do things differently.
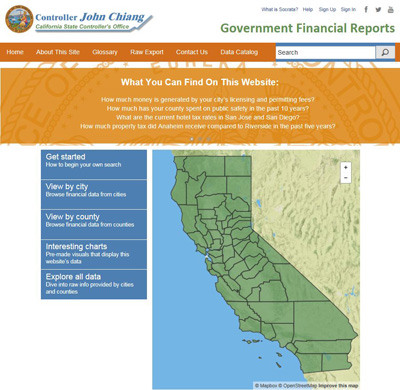
I launched bythenumbers.sco.ca.gov, making it easier for public officials and citizens to look up data, download raw numbers, create charts and search for other financial data by offering dropdown menus that allow users to drill into more specific financial information.
In significantly greater detail than offered in the previous paper reports, the new website covers funds received and spent by California cities and counties, as well as property they own and amounts they owe. The “Open Data” format allows information to be viewed, downloaded, converted into charts and shared.
Later this fall, we will introduce major upgrades to the website that will not only include additional tools and features based on user feedback over the coming months, but will also provide data for each of California's approximately 130 pension systems.
I am proud of bythenumbers.sco.ca.gov because it highlights how the State and local governments can harness advances in technology to open up the books and encourage the public to take a look. And, it is a logical, good-government progression from the transparency efforts I started in the wake of the City of Bell scandal in 2010.
When the working class City of Bell became a poster child for how any community in any part of the state can perpetuate the looting of its taxpayers – when its civic leaders set salaries, award government contracts, and manage public resources outside of public scrutiny – I pulled the doors wide open on public compensation.
In October 2010, I launched a one-stop website containing employee compensation data for every city and county elected official and public employee – what we now call publicpay.ca.gov.
Since then, we’ve expanded the website to include detailed data covering wages, overtime, bonus pay, pensions, and health benefits for 58 counties, more than 450 cities, more than 2,900 special districts, more than 100 higher education providers as well as most state employees – to cover a total of more than 1.2 million positions on an annual basis.
My office redesigned the website in 2012 to improve usability and add analytic tools. It now includes maps, search functions, and custom report-building features, and has been a helpful resource for the public, media, researchers, and many local governments. To date, the site has been read more than 7.8 million times.
I expanded the site recently to include compensation data for nearly 270,000 University of California employees and more than 20,000 Superior Court employees, and plan to add information from K-12 schools, fair boards and local First 5 commissions.
Today, anyone can visit publicpay.ca.gov and find user-friendly search functions, and custom report-building tools. Users can download raw data for their own research and watch video tutorials.
The site is a roadmap for what is included in public pay and how tax dollars are spent in each of our communities. And as a whole, it shows government entities cooperating to better inform all Californians at a time when transparency promotes accountability, protects taxpayers from abusive and wasteful spending, and fosters increased public participation. And because publicpay.ca.gov was created to prevent the next Bell, state and local governments now have a new tool to locate, investigate and expose waste and fraud.
Still, I find it encouraging that my office hasn’t stopped pushing for better technology to increase transparency in a meaningful way. When voters approved Proposition 30 – the temporary tax increase in November 2012 – to stabilize the fiscal health of K-12 schools and community colleges, we began restoring what was owed to public education after years of drastic cuts.
I launched a website – trackprop30.ca.gov – to track every tax dollar raised by Proposition 30 to uphold the promises made to the public. This transparency tool helps taxpayers monitor every dollar raised, where it was allocated, and how it will be spent.
In approving temporary tax increases, voters entrusted their elected officials to use those extra funds to stave off more than $5 billion in cuts to schools and help restore their fiscal stability. The California Department of Education and the California Community Colleges worked with my office to share this important information with the public. We share the belief that being open and honest with information about our school’s finances equips the public to play a bigger role in the governance of our state.
There is much more work to do to open the books and bring government to the people, and I will continue to look for better uses of technology that make it easier for Californians to engage in their communities and with their governments.